


VACCINATED v UNVACCINATED STUDY
- Mark Playne

- Jun 23, 2022
- 3 min read
Updated: Jun 25, 2022
The holy grail to end all discussion on vaccine safety has always been a simple vaccinated versus jab-free study.
In February 2019 Oregon Pediatrician Dr. Paul Thomas was challenged by his state local Medical Board to prove his alternative care plan was safer than the standard 70 jab + CDC schedule.
He hired an outside expert to analyse his patients data, a pool of resources from 2700 vaccinated and 560 unvaccinated children.
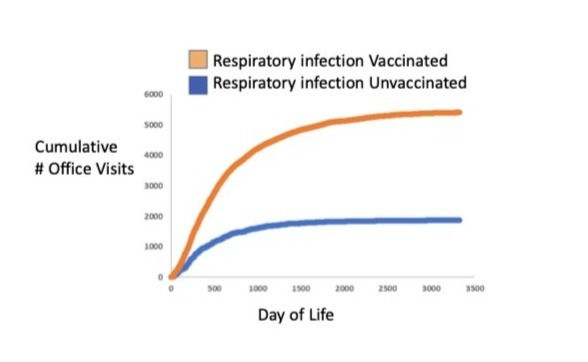
The graphs are measuring office visits against the age of the children per condition.
I.e presuming the more times the child visits the doctor about a condition, the worse they were with that condition.
On the graphs below, the orange lines represent the vaccinated and the blue line represents the jab-free children.
The ADHD graph shows that not one jab-free child made a single visit to the doctor concerning ADHD during the ten years covered by the data.
This information is critical to understand where the surge of SEN (Special Educational Need) children has originated.
How did the Oregon Medical Board respond when presented with the data, graphs and proof of comparative safety they had requested of Dr. Paul Thomas?
Due to the embarrassing truths, the foot soldiers of the pharmafia stripped him of his medical licence, with media hit jobs articles such as this: https://www.wweek.com/news/state/2020/12/05/prominent-anti-vaccine-pediatrician-dr-paul-thomas-has-license-suspended-by-the-oregon-medical-board/
However, as you can see below, the graphs speak for themselves...


DOWNLOAD THE ABOVE SLIDES HERE:
Dr. Paul Thomas points out that his study might be seen as weak alone.
But they are not alone.
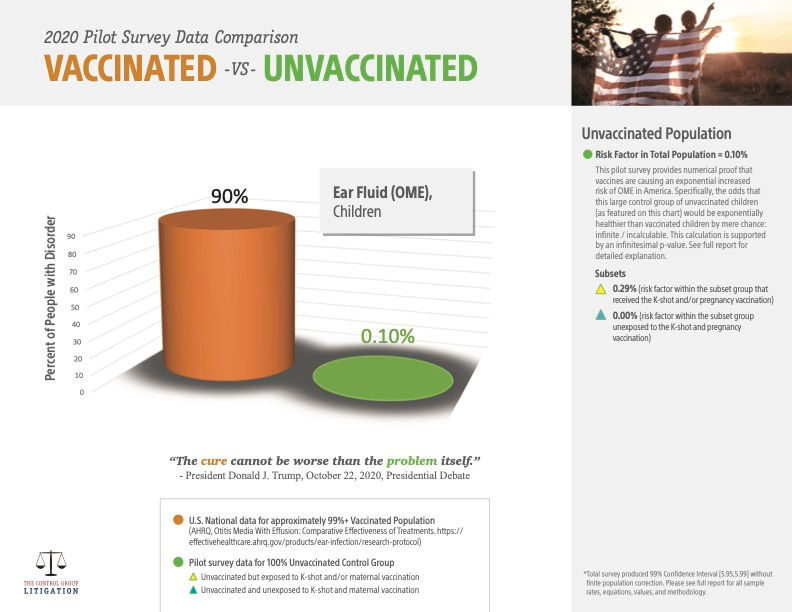
The work of the US founded Control group (not to be confused with the also superb UK based control group) are below. The graphs speak for themselves.
(The full PDF presentations can be downloaded at end)


DOWNLOAD THE ALL 21 CONTROL GROUP SLIDES HERE
DOWNLOAD DR PAUL THOMAS FULL PDF PRESENTATION HERE (The video is a short clip form the presentation)
Find Dr Paul's work here: https://www.doctorsandscience.com/presentations.html
An interesting paper mentioned by Dr Paul Thomas by Hooker and Miller.
Objective: The aim of this study was to compare the health of vaccinated versus unvaccinated pediatric populations.
Methods: Using data from three medical practices in the United States with children born between November 2005 and June 2015, vaccinated children were compared to unvaccinated children during the first year of life for later incidence of developmental delays, asthma, ear infections and gastrointestinal disorders. All diagnoses utilized International Classification of Diseases–9 and International Classification of Diseases–10 codes through medical chart review. Subjects were a minimum of 3 years of age, stratified based on medical practice, year of birth and gender and compared using a logistic regression model.
Results: Vaccination before 1 year of age was associated with increased odds of developmental delays (OR = 2.18, 95% CI 1.47–3.24), asthma (OR = 4.49, 95% CI 2.04–9.88) and ear infections (OR = 2.13, 95% CI 1.63–2.78). In a quartile analysis, subjects were grouped by number of vaccine doses received in the first year of life. Higher odds ratios were observed in Quartiles 3 and 4 (where more vaccine doses were received) for all four health conditions considered, as compared to Quartile 1. In a temporal analysis, developmental delays showed a linear increase as the age cut-offs increased from 6 to 12 to 18 to 24 months of age (ORs = 1.95, 2.18, 2.92 and 3.51, respectively). Slightly higher ORs were also observed for all four health conditions when time permitted for a diagnosis was extended from ⩾ 3 years of age to ⩾ 5 years of age.
Conclusion: In this study, which only allowed for the calculation of unadjusted observational associations, higher ORs were observed within the vaccinated versus unvaccinated group for developmental delays, asthma and ear infections.
Further study is necessary to understand the full spectrum of health effects associated with childhood vaccination.


Thanks to people like Marki, Louise Fisher and many more, these indescribably foolish arguments can expose the approval procedure, and the culprits can be brought to justice.
VACCINATED vs. UNVACCINATED STUDY has been at the heart of all my work for +35 years. It has been countered with judgmental arguments such as "it is unethical to fail to vaccinate children when vaccines are so safe and effective"? This argument is as foolish as arguing "we prescribe to inject in each leg/arm when two or more vaccines untested for 'synergy effect' are given"..... –yes, you heard that right. It is the level of foolish arguments the so-called experts work from. I don't expect you to believe me without some kind of…
The article states it is research on those who follow the CDC vaccine schedule (70 vaccines)
Please could you say WHAT vaccines you are talking about. Presumably not Covid, as the studies predate those 'vaccines', but what vaccines are given to kids in the USA.? (I'm British)
Great Post